How to spot a recession
Do we actually live in a recession currently? We are overwhelmed with information about the recession coming or not. Why would you want to spot a recession?
- You can for sure invest correctly in the market
- Know that times might get a bit worse
- Generally recessions is a good time for investments as well
Ms Sahm in a report argues that when the three-month average unemployment rate is at least 0.5 percentage points above its minimum from the previous 12 months, the economy is in a recession. Let’s check it out.
Grabbing data from tradingeconomics to collect the monthly unemployment rates.
Edit: Correction of the recession checker from the brookings with regards to taking care of spikes to use moving average of 3 months.
import pandas as pd
import altair as alt
unemployment = {
'2018-10-01': 3.8,
'2018-11-01': 3.7,
'2018-12-01': 3.9,
'2019-01-01': 4.0,
'2019-02-01': 3.8,
'2019-03-01': 3.8,
'2019-04-01': 3.6,
'2019-05-01': 3.6,
'2019-06-01': 3.7,
'2019-07-01': 3.7,
'2019-08-01': 3.7,
'2019-09-01': 3.5,
}df = pd.DataFrame(unemployment.values(), index=unemployment.keys(), columns=['unemployment_rate'])df| unemployment_rate | |
|---|---|
| 2018-10-01 | 3.8 |
| 2018-11-01 | 3.7 |
| 2018-12-01 | 3.9 |
| 2019-01-01 | 4.0 |
| 2019-02-01 | 3.8 |
| 2019-03-01 | 3.8 |
| 2019-04-01 | 3.6 |
| 2019-05-01 | 3.6 |
| 2019-06-01 | 3.7 |
| 2019-07-01 | 3.7 |
| 2019-08-01 | 3.7 |
| 2019-09-01 | 3.5 |
Recession
where
Creating the calculations
This is the actual formula for calculating if the recession is already happening
r_min = min(df['unemployment_rate'])
r_ma3 = df['unemployment_rate'].rolling(3).mean().tail(1)[0]

recession = r_ma3 > r_min + 0.5
dates = df.index
df['date'] = dates
df['r_min'] = r_min
df['r_limit'] = r_min + 0.5
df['r_ma3'] = r_ma3
base = alt.Chart(df).encode(
x='date:T'
)
bars = base.mark_bar().encode(
y='unemployment_rate:Q'
)
rule = base.mark_line(color='red').encode(
y='r_limit:Q',
)
rule2 = base.mark_line(color='yellow').encode(
y='r_ma3:Q',
)
bars + rule + rule2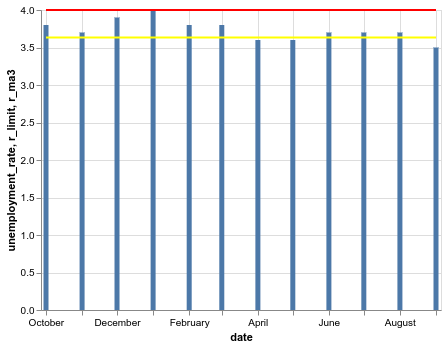
If the yellow line crosses the red line then we would have a recession.