Probability can be used to describe the relationship between given values and the chance/probability of some event occuring. This post will outline how we describe probability of some event given a fitted distribution. We will fit a distribution to then calculate the survival function using the z-score of our limit given a fitted distribution.
from scipy import stats
import pandas as pd
import numpy as np
import altair as alt
alt.data_transformers.enable('json')DataTransformerRegistry.enable('json')df = pd.read_csv('example_parameter.csv')maximum likelihood estimate
In essence we either try distributions until it fits the data the best, or we know a analytical solution for the distribution at hand and get the best fitted distribution of the data right away.
mu, std = stats.norm.fit(df)
mu, std
(5.669365294764912, 1.7405441476684247)# x between -3 and above with .001 steps.
x_axis = np.arange(
-3,
mu + 5 * std,
0.001
)
# Mean = mu, SD = std.
y_axis = stats.norm.pdf(
x_axis,
mu,
std
)
# plot
df = pd.DataFrame()
df['x'] = x_axis
df['y'] = y_axis
alt.Chart(data=df).mark_line().encode(
x='x:Q',
y='y:Q'
).properties(
title='Probability'
)
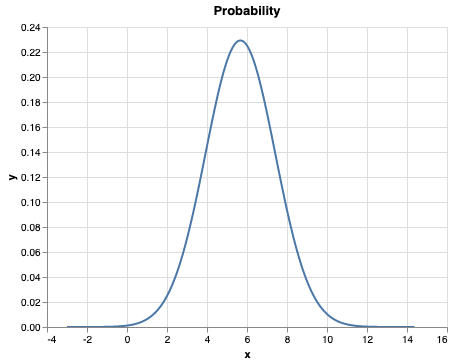
since we have now fitted a curve around a mu (i.e. not around 0) which is the standard way of showing a distribution. We will here demonstrate how to calculate the likelihood of being above a certain value based on the data that we have seen using the survival function.
2. probability of the survival function
is the
# plot
x_axis = x_axis

y_axis = 1 - stats.norm.cdf(x_axis, mu, std)

df = pd.DataFrame()
df['parameter'] = x_axis
df['1 - cdf'] = y_axis
line = alt.Chart(df).mark_line().encode(
    x='parameter:Q',
    y='1 - cdf:Q'
).properties(
    title='Probability of being above limit'
)

vertical_y = np.arange(
    0,
    2,
    0.001
)
df = pd.DataFrame()
df['vertical_y'] = vertical_y
df['limit'] = limit

threshold = pd.DataFrame([{"threshold": limit}])
rule = alt.Chart(threshold).mark_rule(color='firebrick').encode(
    alt.X('threshold:Q', title='parameter')
)

line + rule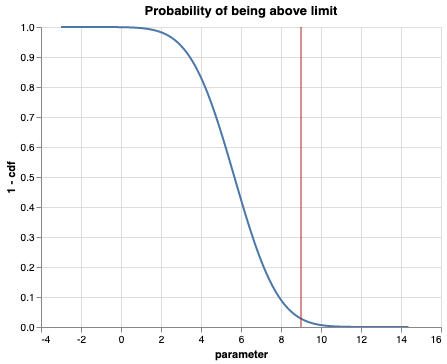
3. take the z-score of the fitted distribution
Since each distribution is centered around
which says how many standard deviations we are from its
recall again that we want to see the probability of somethign accuring above the limit value. i.e. what is the probability that we exceed this value
# set the limit of the measure
limit = 9
z = (limit - mu) / std
z1.9135594519085861since we now have center our limit value around the
meaning a
# x between -3 and above with .001 steps.
x_axis = np.arange(
    -3,
    mu + 5 * std,
    0.001
)

# Mean = mu, SD = std.
y_axis = stats.norm.pdf(
    x_axis,
    0,
    1
)

# plot
df = pd.DataFrame()
df['x'] = x_axis
df['y'] = y_axis
alt.Chart(data=df).mark_line().encode(
    x='x:Q',
    y='y:Q'
).properties(
    title='Probability'
)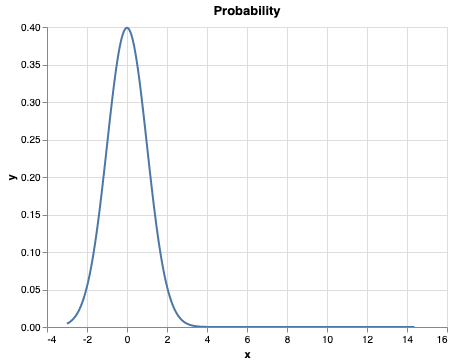
# With z score we can now use a normal distribution for our calculations

# plot
x_axis = x_axis

y_axis = 1 - stats.norm.cdf(x_axis, 0, 1)

df = pd.DataFrame()
df['parameter'] = x_axis
df['1 - cdf'] = y_axis
line = alt.Chart(df).mark_line().encode(
    x='parameter:Q',
    y='1 - cdf:Q'
).properties(
    title='Probability of being above limit'
)

vertical_y = np.arange(
    0,
    2,
    0.001
)


threshold = pd.DataFrame([
    {"prev_threshold": limit},
    {"z_threshold": z}
])

rule = alt.Chart(threshold).mark_rule(color='firebrick').encode(
    x='prev_threshold:Q',
    opacity=alt.OpacityValue(0.6)
)

rule2 = alt.Chart(threshold).mark_rule(color='firebrick').encode(
    alt.X('z_threshold:Q'),
    size=alt.SizeValue(2)
)

line + (rule + rule2)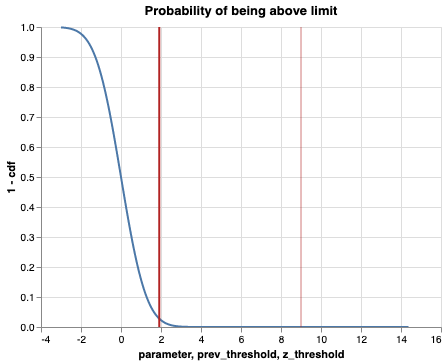
With the calculated z-score, we now have a way of also using the normal distribution without the need to explicitly tell
Back to the real world!!
Instead of writing the survival function which we will explicitly calculate the probability like so:
# score of the survival function
p = stats.norm.sf(limit, mu, std)
p0.02783823512029548We can now instead use the z-score for each call to a distribution.
# score of the survival function
p = stats.norm.sf(z)
p0.02783823512029548And we can see that it gives the same probability, just using different scales for the